How to reduce the chance of rising costs cutting into your restaurant’s profits
Learn how the right tools can help you to reduce the chance of rising costs cutting into your restaurant’s profits.

There’s no doubt that running a restaurant is more expensive than ever.
Average food costs are up 20% year over year, according to the National Restaurant Association’s annual State of the Industry report.
Add to that 43% of restaurant operators are still carrying debt accumulated during the pandemic.
More so, 70% of operators say they have hard-to-fill job openings, which ends up putting more cost pressures on the business. Food shortages persist, and nearly four out of every 10 operators aren’t profitable.
The average restaurant today has a profit margin of between 3% to 5%, yet there are some operators with close to 20% profit margins, despite major headwinds.
How do some operators rake up four to five times the profit of others?
They’re tracking costs, measuring everything coming in both the back and front doors, and then managing and improving.
They can do this using technology, and you can too. That’s what we talk about in this article.
Breaking down costs
Restaurant costs fall into four major buckets:
- Food
- Beverages
- Labor
- Overheads.
The first three are self-evident and combined account for prime costs.
Overhead covers costs not associated with food, beverage and labor, such as linens, glassware, paper goods, swipe fees, marketing, leases, taxes, utilities, etc.
These expenses aren’t assigned to a specific menu item and aren’t included in the cost of goods sold. Instead, they’re considered selling, general and administrative (SG&A) expenses.
If you’re aiming for better profitability, prime costs should come in at 60% to 65% of total revenue.
Meanwhile, SG&A should come in at 15% to 20%.
Sound impossible?
It’s not if you pull the right levers.
One of the strategies in play is menu engineering. This allows analysis of the profitability of each menu item to optimize the most profitable dishes while considering ingredient substitutions or portion adjustments for less profitable items.
You should classify menu items into four categories:
- Popular high-profitability items
- Popular low-profitability items
- Unpopular high-profitability items
- Unpopular low-profitability items.
Knowing which menu item is which can help solve some dilemmas.
To do this, you’ll need the following data:
- Menu item sales data: This includes the number of units sold, selling price and revenue generated for an individual menu item over a specific period, generally no less than a month up to a quarter. Be sure to include any promotional items or limited time offers (LTOs) as metrics from these can offer further insights.
- Ingredient cost: For each menu item, the cost of each ingredient used must be tracked. This includes costs such as raw materials, spices, sauces and garnishes.
- Menu item contribution margin: Calculate the contribution margin for each menu item by subtracting the ingredient cost from the selling price. The contribution margin shows the profit generated by each item before considering other overhead costs.
- Menu item cost percentage: Calculate the cost percentage for each menu item by dividing the ingredient cost by the selling price and multiplying by 100. The cost percentage shows the proportion of the selling price that goes towards covering the ingredient cost.
- Seasonal ingredient costs: Consider any seasonal variations in ingredient costs as this can affect the profitability of certain menu items during specific times of the year.
- Menu item cost history: Review historical ingredient cost data to find any significant fluctuations that may have affected profitability in the past.
You should be able to find the information needed by using data from the point of sale, inventory and accounting systems.
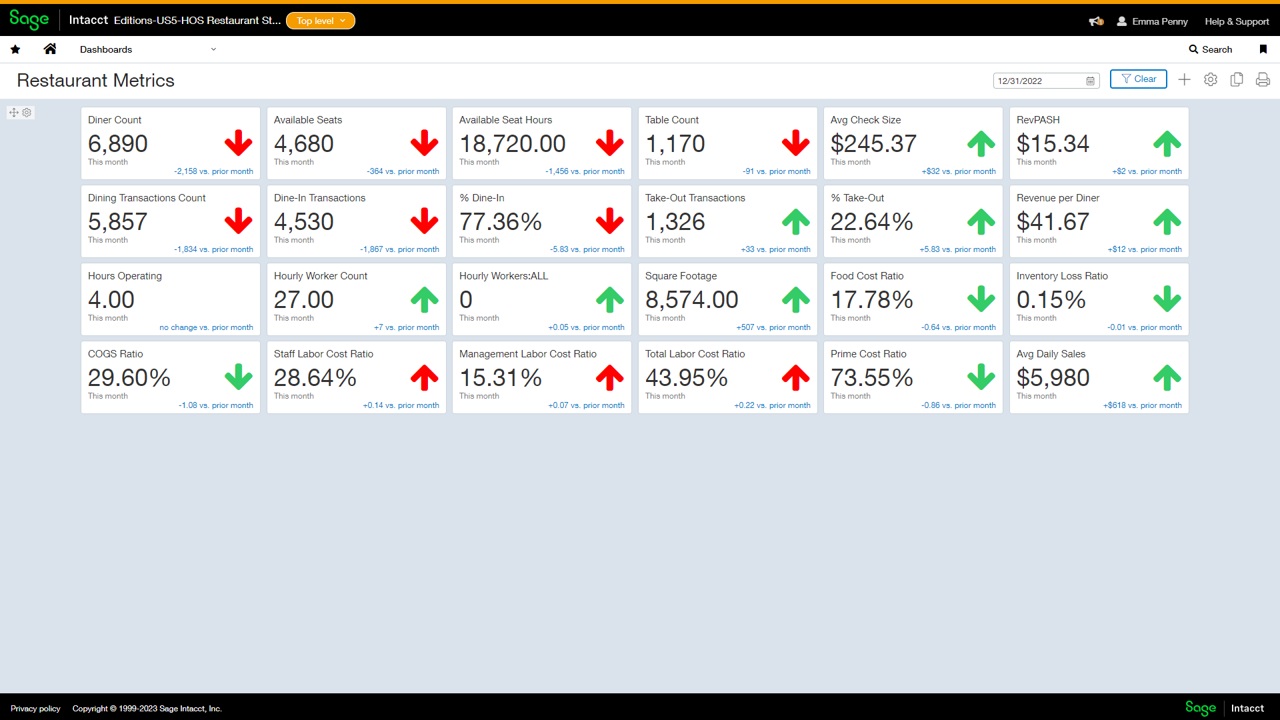
You can view all the information on a single dashboard using an account platform that integrates with other systems.
This way you’re not having to switch between platforms.
Additionally, you can look at this information by location, so you can easily compare efficiency.
By collecting and analyzing this information, you can find which menu items contribute the most to your profits and which ones may need adjustments to improve profitability.
This data-driven approach allows you to make informed decisions about pricing, promotions, and menu design to control costs effectively while keeping the overall quality of the menu offerings.
Also read our step-by-step guide on how to calculate the selling price using markup percentage.
Tracking costs
Using the right accounting platform can help you cut costs while maintaining quality, allowing you to track and categorize expenses accurately.
With a clear breakdown of costs, you can find areas where spending is high and take steps to drive down costs.
Regularly analyzing reports can highlight potential inefficiencies and cost-saving opportunities.
Here are some of the areas where a sophisticated, multi-dimensional accounting platform can provide insights:
- Cost of goods sold (COGS) analysis: By closely watching COGS, you can identify trends, seasonal fluctuations and discrepancies. This information enables you to negotiate better prices with suppliers and make smarter purchasing decisions.
- Budgeting and forecasting: You can create budgets and financial forecasts. These projections help in setting realistic financial goals and targets, allowing you to plan better and make informed decisions to avoid overspending.
- Automated invoicing and billing: You can automate invoicing and billing processes, reducing the time spent on administrative tasks and minimizing the chance of errors or missed payments.
- Payroll management: Payroll expenses are a significant part of a restaurant’s overall costs. You can streamline payroll processes, ensuring correct and prompt payments to employees, minimizing errors and avoiding unnecessary labor expenses.
- Cash flow management: You can get insights into cash flow patterns, enabling you to manage working capital efficiently and avoid unnecessary borrowing costs.
The bottom line
Despite rising costs, you can still maintain a healthy profit level without raising your prices to a level where you lose valuable customers.
Getting a better handle on costs doesn’t have to be difficult, and you can grow your bottom link.
With the right tools, it’s easier than it sounds.


Ask the author a question or share your advice